Detected Nodes
The Detected tab (
There are various methods that can be used to detect a node within your Guardian instance, including:
-
Manually – On the Detected tab, you can click Detect More Nodes to sync temporarily to a source of choice and manually detect additional nodes. For more information, see Detect More Nodes.
-
An integration sync – You can integrate Guardian with a range of external sources, such as AWS, to enable the automatic detection of nodes within that source. Any nodes that are detected are automatically added to the Detected tab of your Guardian instance. Once an integration has been set up, it will automatically sync every two hours, checking for changes to your assets. For more information on how to set up an integration, see Integrations.
-
Adding nodes in bulk – You can sync and detect nodes from a range of external sources, such as ServiceNow, in order to add nodes in bulk to your Guardian instance. Any nodes that are detected are automatically added to the Detected tab. Adding nodes in bulk does not sync any subsequent changes as, typically, this is a one-time import. However, there are additional options for customization, depending on the source. For more information on how to add nodes in bulk, see Add Nodes in Bulk.
-
Node Network Discovery – This is an optional feature in Guardian that enables the automatic detection of nodes that are network adjacent to existing monitored nodes. Any nodes that are detected are automatically added to the Detected tab.
Note: To enable the Node Network Discovery feature, contact your Cloudhouse Representative.
Best Practice
To automatically detect and sync nodes from an external source, we recommend setting up an integration with your AWS, Azure, or GCP account(s), for example. Once integrated with an external source, an automatic synchronization (between Guardian and the target source) occurs every two hours. For more information on how to alter this interval, see Job Schedule. The sync event calls out to the target source using the supplied credentials to return a list of detected nodes and their corresponding details. By default, any nodes that Guardian detects are automatically stored within the Detected tab for processing.
Note: For more information on how to set up an automatic synchronization between Guardian and a target source, see Integrations.
With an integration set up, the following functionality is enabled:
-
New nodes that are identified and synced are added to the Detected tab.
-
New nodes that are identified, but unable to sync, are registered in the sync job report, see Job History for more information.
-
Existing nodes that have already been detected remain in the Detected tab.
-
Existing nodes that are already being monitored remain in the Monitored tab.
You can then review the nodes that have been detected on a regular basis, knowing that they are up to date, and action them accordingly. For more information on how to do this, see below.
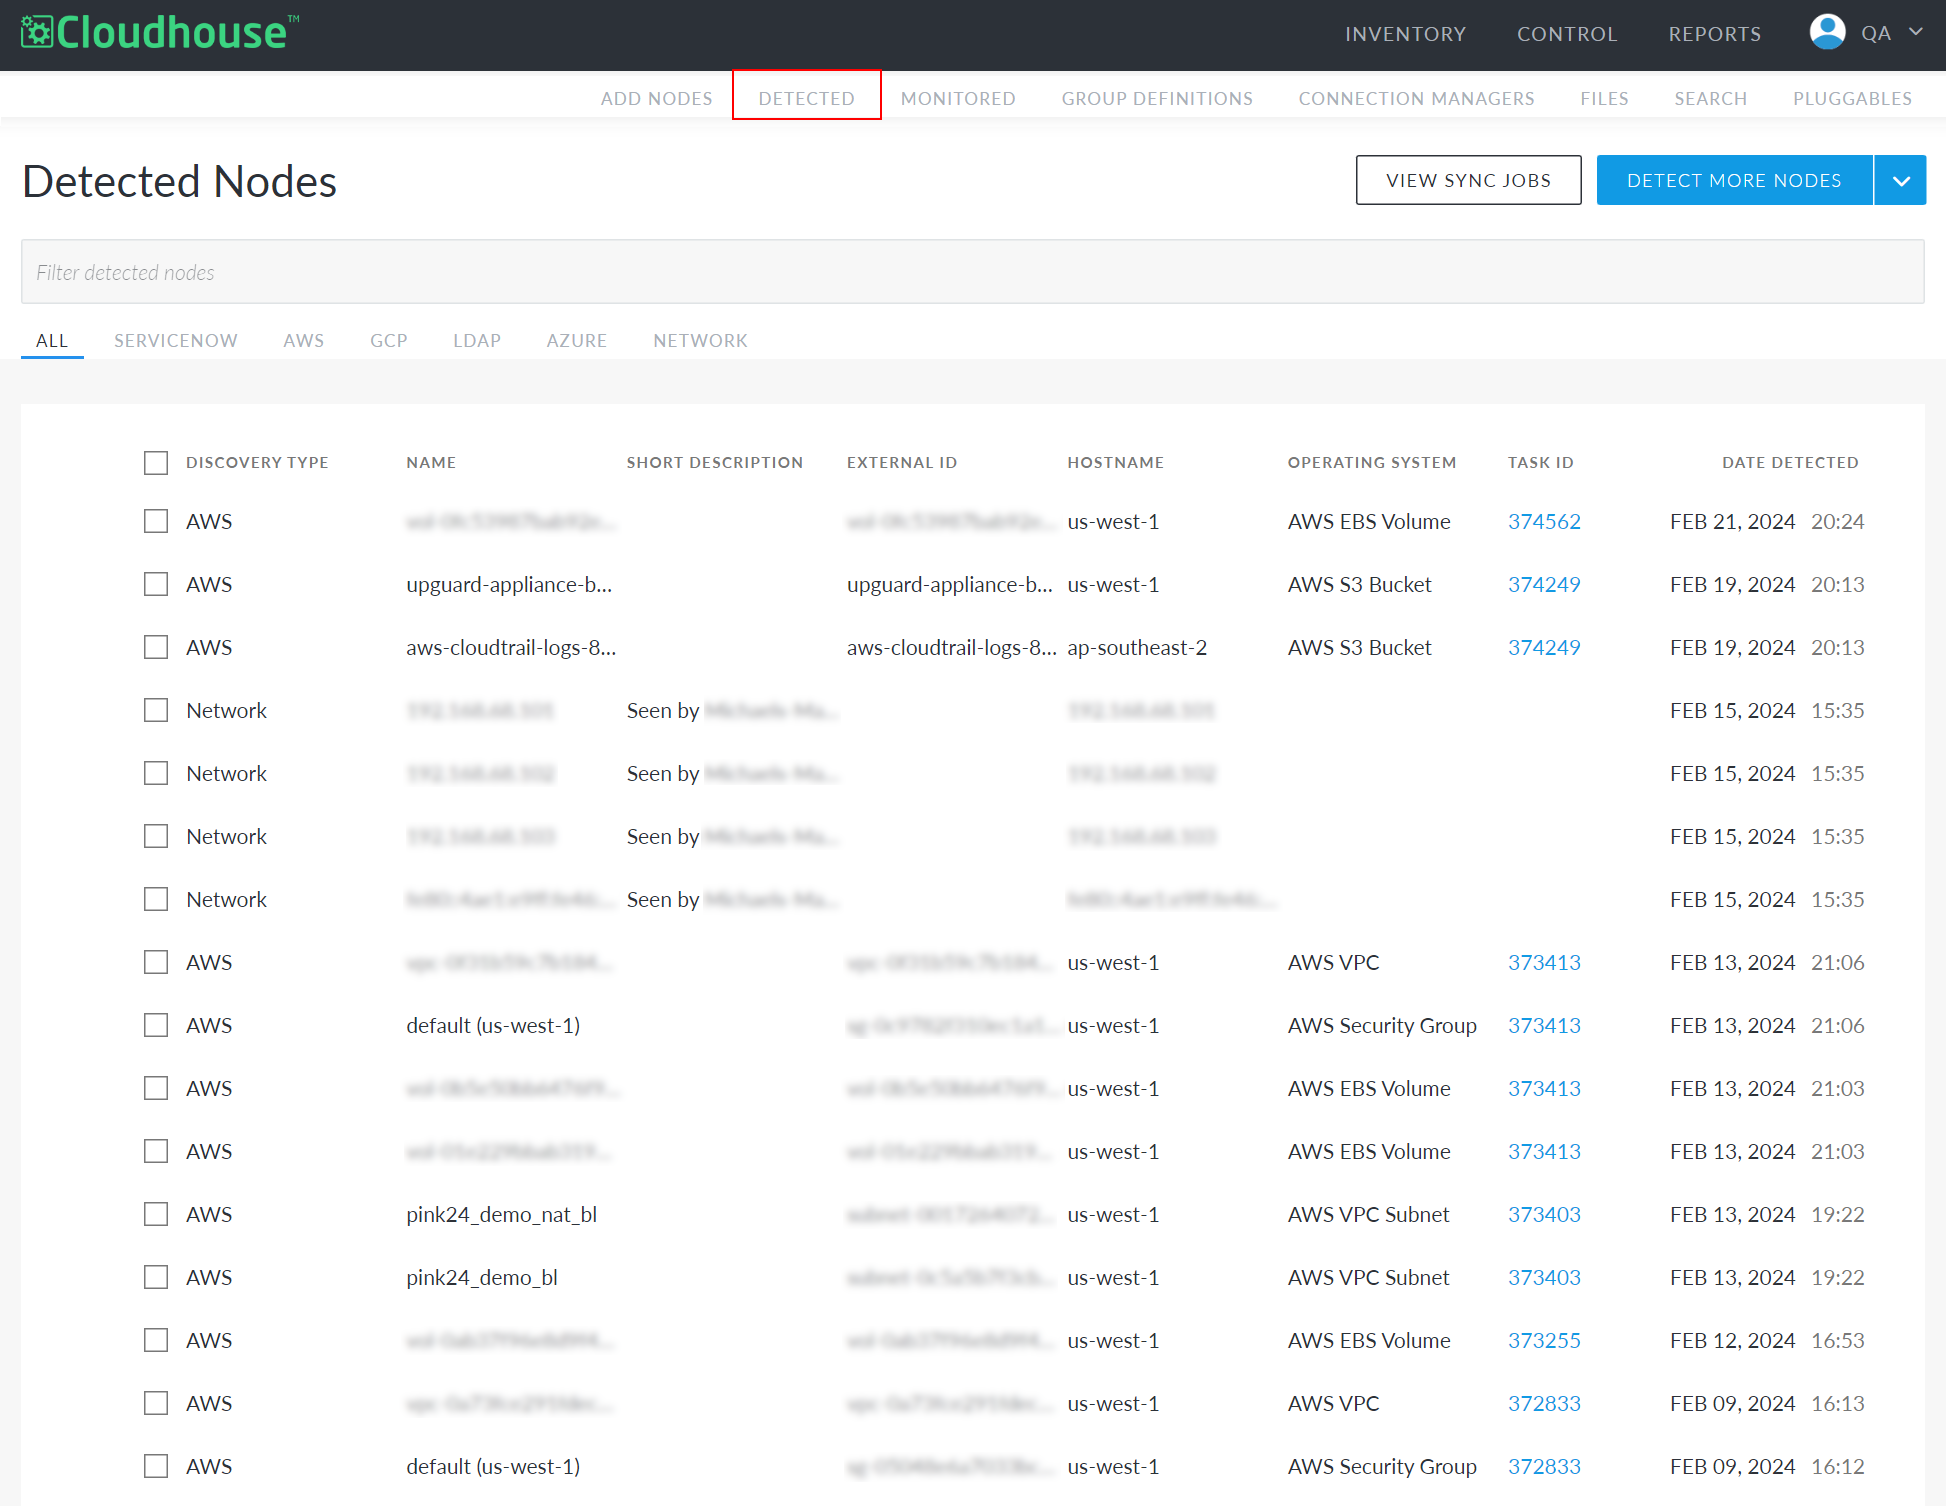
Detected Nodes
The Detected Nodes page displays all of the nodes that have been detected within an external source, typically via an integration. You can click to view All detected nodes, or filter the display to show nodes that were detected within a specific source, such as AWS. Click the corresponding tab, or use the search bar to filter your results. Here, you can choose to add nodes for monitoring, edit, delete, or Detect More Nodes. Additionally, you can click the View Sync Jobs button to display a list of all the 'Find Nodes' job types being run within the Job History tab.

Each node in the table has a check box that facilitates multi-select functionality. Select one or more nodes to display the following buttons:
-
Add Nodes – Add the selected nodes to the Monitored tab. If selected, the Prepare node for monitoring page is displayed. For more information, see Prepare Node(s) for Monitoring.
-
Edit Nodes – Option to edit the selected node's settings. If selected, the Edit Node page is displayed, see Edit Node for more information on the fields displayed on this page.
-
Delete Nodes – Option to delete the selected node(s). If selected, the node is deleted from your Guardian instance. To re-add the node, you need to sync to the node's source to detect it once more.
The Detected Nodes table displays information about each of the detected nodes within the following columns:
| Column | Description |
|---|---|
| Discovery Type | The source the nodes were detected from. For example, 'AWS'. |
| Name | The name of the node that was detected. |
| Short Description | Optional short description. If Node Network Discovery is enabled, any nodes that are detected via this feature will have, 'Seen by [network adjacent monitored node]' here. |
| External ID | The property required to authorize Guardian's connection to the node. |
| Hostname | The hostname of the node. |
| Operating System | The operating system that the node is running on. For example, 'Windows XP' or 'Linux Directory'. |
| Task ID | The ID of the task that was run, identifying the node. Click this link to display the Job Information page, with details on each task that was included in the selected job run. |
| Date Detected | The date the node was detected and added to your Guardian instance. |
Detect More Nodes
Even with an integration sync set up, you may want to manually detect nodes from a particular source (or using a particular method). Click the Detect More Nodes button at the top of the Detected Nodes page to display the Node Detection via page.
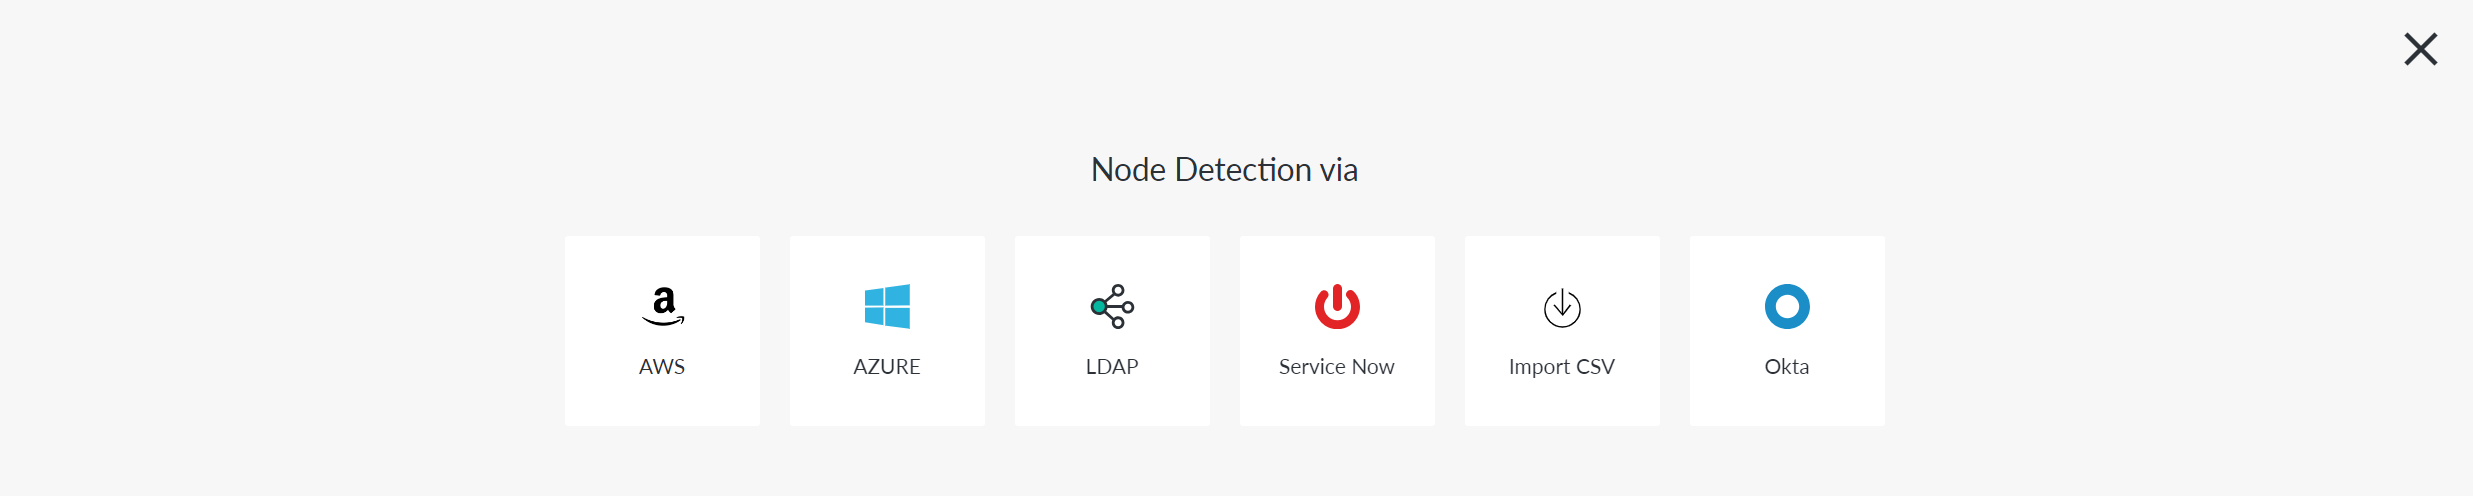
Here, the following options are displayed:
-
AWS – If selected, the Add Nodes via AWS page is displayed. For more information on the fields displayed here, see Add Nodes in Bulk via AWS.
-
Azure – If selected, the Add Nodes via Azure page is displayed. For more information on the fields displayed here, see Add Nodes in Bulk via Azure.
-
GCP – If selected, the Add Nodes via GCP page is displayed. For more information on the fields displayed here, see Add Nodes in Bulk via GCP.
-
LDAP – If selected, the Add Nodes via LDAP page is displayed. For more information on the fields displayed here, see Add Nodes in Bulk via LDAP.
-
Service Now – If selected, the Add Nodes via Service Now page is displayed. For more information on the fields displayed here, see Add Nodes in Bulk via ServiceNow.
-
Import CSV – If selected, the Add Nodes via CSV page is displayed. For more information on the fields displayed here, see Add Nodes in Bulk via CSV.
-
Okta – If selected, the Add Nodes via Okta page is displayed. For more information on the fields displayed here, see Add Nodes in Bulk via Okta.
If you choose to detect nodes via one of the above options, a temporary integration is made with the target source and any nodes that are detected are added to the Detected tab of your Guardian instance for processing.
Prepare Node(s) for Monitoring
If you decide that you want to upgrade one or more nodes to your monitored list, you must first prepare the node(s) for monitoring. This entails the assignment of an environment and node group, so that the selected nodes are organized into the correct groups.
Note: Depending on the node type, there may be additional fields you need to fill in to prepare the node for monitoring.
To prepare node(s) for monitoring, complete the following steps:
-
In the Detected tab, select the checkbox of the node(s) you want to monitor.
-
Click the Add Nodes button. The Prepare nodes for monitoring page is displayed.
-
Select an Environment from the drop-down list.

-
Select a Node Group from the drop-down list.
-
Click Finish to add the selected node(s) to the Monitored tab. Alternatively, click Finish and Add More to select more nodes for monitoring.
The node(s) are then assigned to the selected node group and environment and upgraded to the Monitored tab. The newly monitored node(s) are displayed within the assigned node group with the message 'This node has not been scanned.' Next, you are required to select the newly added node(s) and edit their settings, so that they have the full configuration settings required for accessing and scanning the node(s) within Guardian. For more information on how to do this, see Edit Node.
