Monitored Nodes
The Monitored tab (
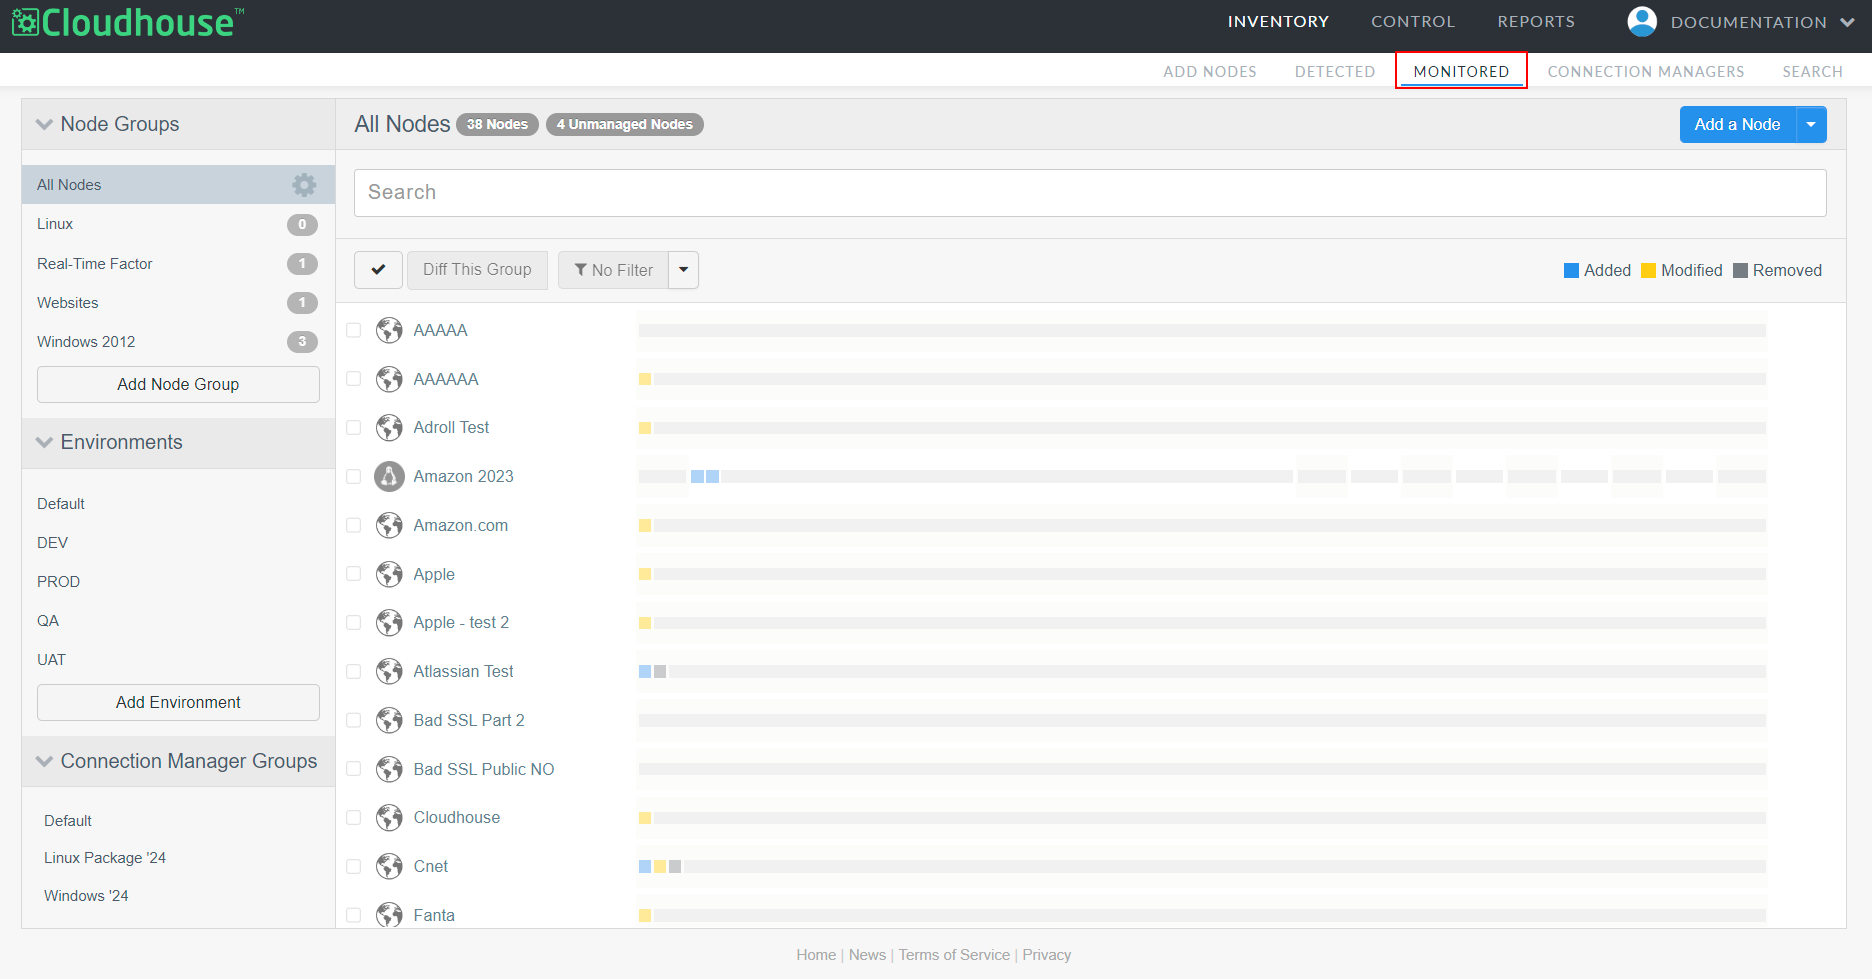
When a node is added to the Monitored tab, you are effectively consenting to the regular scanning of that node within Guardian. This enables any changes that occur to your node(s) to be tracked and monitored, enabling the effective troubleshooting of your node over time. There are various methods available to add a node to the Monitored tab, including:
-
Manually – In the Detected tab, you can manually add a detected node to the Monitored tab. To do so, you must ensure that the node's configuration settings are applied correctly. Then, you can assign it to an environment and node group for regular scanning and monitoring. For more information, see Detected Nodes.
- Integration Sync – You can integrate Guardian with a range of external sources, such as AWS, to enable the automatic detection of nodes within that source. By default, any nodes that are detected are added to the Detected tab. However, if you select the Automatically start monitoring and scanning newly detected nodes checkbox when creating the integration, those nodes are added to the Monitored tab instead. For more information, see Integrations.
- Add Nodes in Bulk via CSV – You can import nodes in bulk to Guardian by populating a CSV file with the information required to retrieve the nodes from their respective areas. This process automatically adds the nodes contained within the CSV file to the Monitored tab. For more information, see Add Nodes in Bulk via CSV.
- Add Nodes in Bulk – You can automatically sync and detect nodes from a range of external sources, such as ServiceNow, in order to add nodes in bulk to your Guardian instance. By default, any nodes that are detected are added to the Detected tab. However, if you select the Automatically start monitoring and scanning newly detected nodes checkbox when creating the temporary integration to the source, those nodes are added to the Monitored tab instead. For more information, see Add Nodes in Bulk.
Note: If the Automatically start monitoring and scanning detected nodes option is not selected, the detected nodes are added to the Detected tab instead.
By default, all monitored nodes are added to the 'All Nodes' node group. However, you can organize your monitored nodes into one or more node groups for more effective scanning and configuration. For example, you could schedule regular scans for a particular node group, assign policies to the node group, and run benchmarks against the node group to evaluate whether the nodes are compliant with a specific set of parameters.
In addition, all nodes should be organized into the correct environment and assigned to either a Windows or Linux Connection Manager group for scanning. Whereas a node can belong to multiple node groups, a node can only belong to one environment and one Connection Manager group. Monitored nodes have the greatest level of control and are the nodes that you will interact with most in Guardian. Typically, when referring to a node in Guardian, this denotes a monitored node.
Monitored Groups
The currently monitored nodes within your Guardian instance are divided amongst the following organizational units:
-
Nodes Groups – Node groups are used to group nodes with similar properties and roles, such as device type, operating system, application, etc. At this level, you can assign policies to uphold a desired state of configuration, apply benchmarks to evaluate whether the nodes are compliant with the stipulated parameters, or use a dynamic group query to automatically assign nodes that meet the specified criteria to the corresponding group. For more information, see Node Groups.
-
Environments – Environments are the top-level organizational unit in Guardian, allowing you to organize nodes into groups that match your own infrastructure, such as development, staging, and production environments. You can utilize Node Rules and Environment Variable Overrides to ensure that the nodes are organized into the correct corresponding environment within your Guardian instance. For more information, see Environments.
-
Connection Manager Groups – Connection Manager groups are used to organize Connection Managers of the same type into groups with similar properties and roles. This drop-down menu displays each of the groups that are currently configured, including each of the nodes that are assigned to each group. To view the Connection Managers that are contained within each group, access the Connection Managers tab (Inventory > Connection Managers).
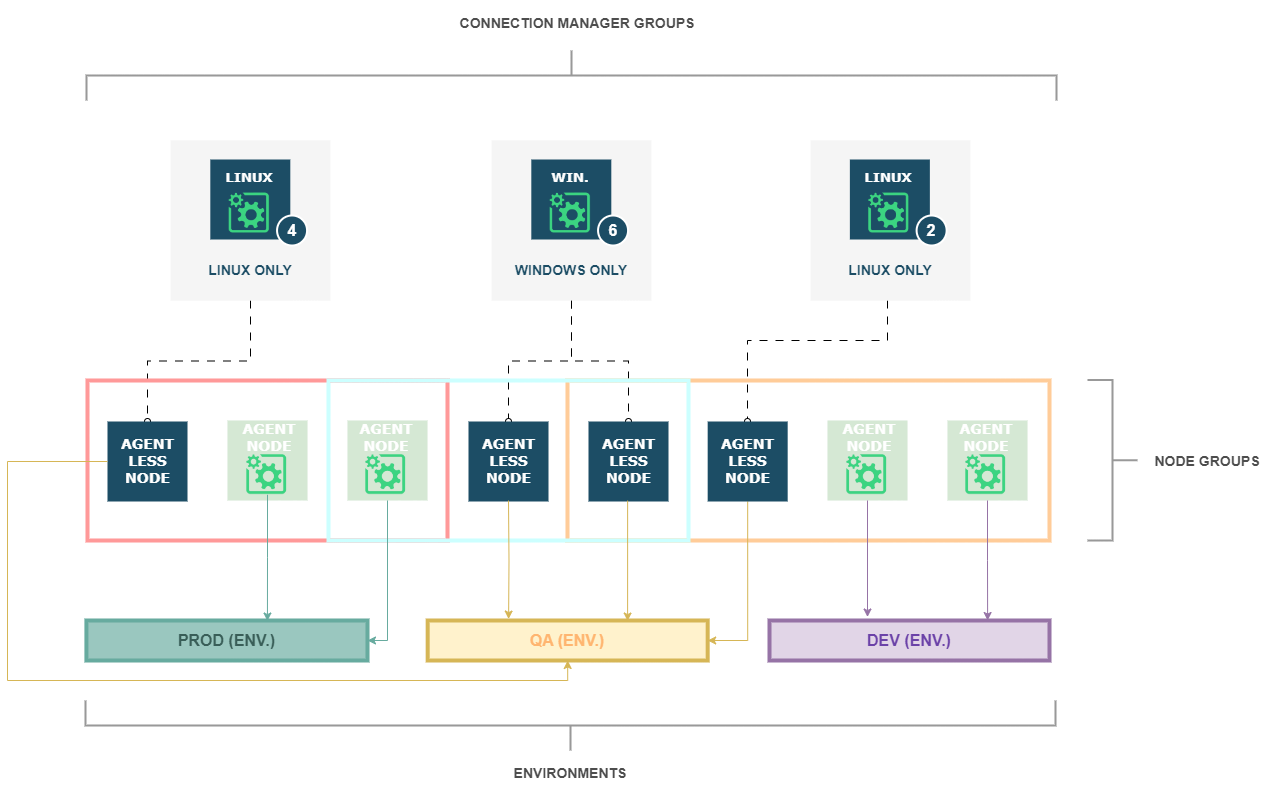
The following table outlines the functional differences between each organizational unit:
| Function | Node Groups | Environments | Connection Manager Groups |
|---|---|---|---|
| Node can be assigned to multiples of this organizational unit | Yes, you can assign a node to multiple node groups. | No, a node can only be assigned to one environment. |
No, a node can only be assigned to one Connection Manager group. |
| Can be assigned policies and benchmarks | Yes, you can assign both Policies and Benchmarks to a node group. | No | No |
| Can schedule node scans at this level | Yes, you can schedule a scan of all nodes within a node group. See Scan – Job Type for more information. | Yes, you can schedule a scan of all nodes within an environment. See Scan – Job Type for more information. | No, you cannot schedule a scan of the nodes within a Connection Manager Group. You can, however, trigger a manual scan from within the selected Connection Manager group. |
| Can use Node Rules to automatically add nodes to this organization unit | Yes, you can use both node rules and Dynamic Group Queries to automatically add nodes that meet the stipulated criteria to the relevant group(s). | Yes, you can use node rules to automatically assign any nodes that match the regular expression pattern(s) to the associated environment. | No, you must manually assign a node to a Connection Manager group. See Assign Nodes to a Connection Manager Group for more information. |
| Responsible for scanning | No | No |
Yes, each node must be assigned to one Connection Manager group that is then responsible for handling all requests triggered by said node(s). |
| Tied to an organization | Yes, each node group is only displayed within the organization it was created in. | Yes, each environment is only displayed within the organization it was created in. | Yes, each Connection Manager group is only displayed within the organization it was created in. |
Node Status Summary
When accessing the Monitored tab, the Node Groups drop-down menu displays 'All Nodes' that are currently being scanned and surveilled within your Guardian instance by default. However, you can also select an alternative option from the Node Groups, Environments, or Connection Manager Groups drop-down menu to display the complete set of nodes that are contained within the selected node group, environment, or connection manager group. Once selected, you can edit, scan, or difference the scan results of multiple nodes (within the selected group or environment) at a time.
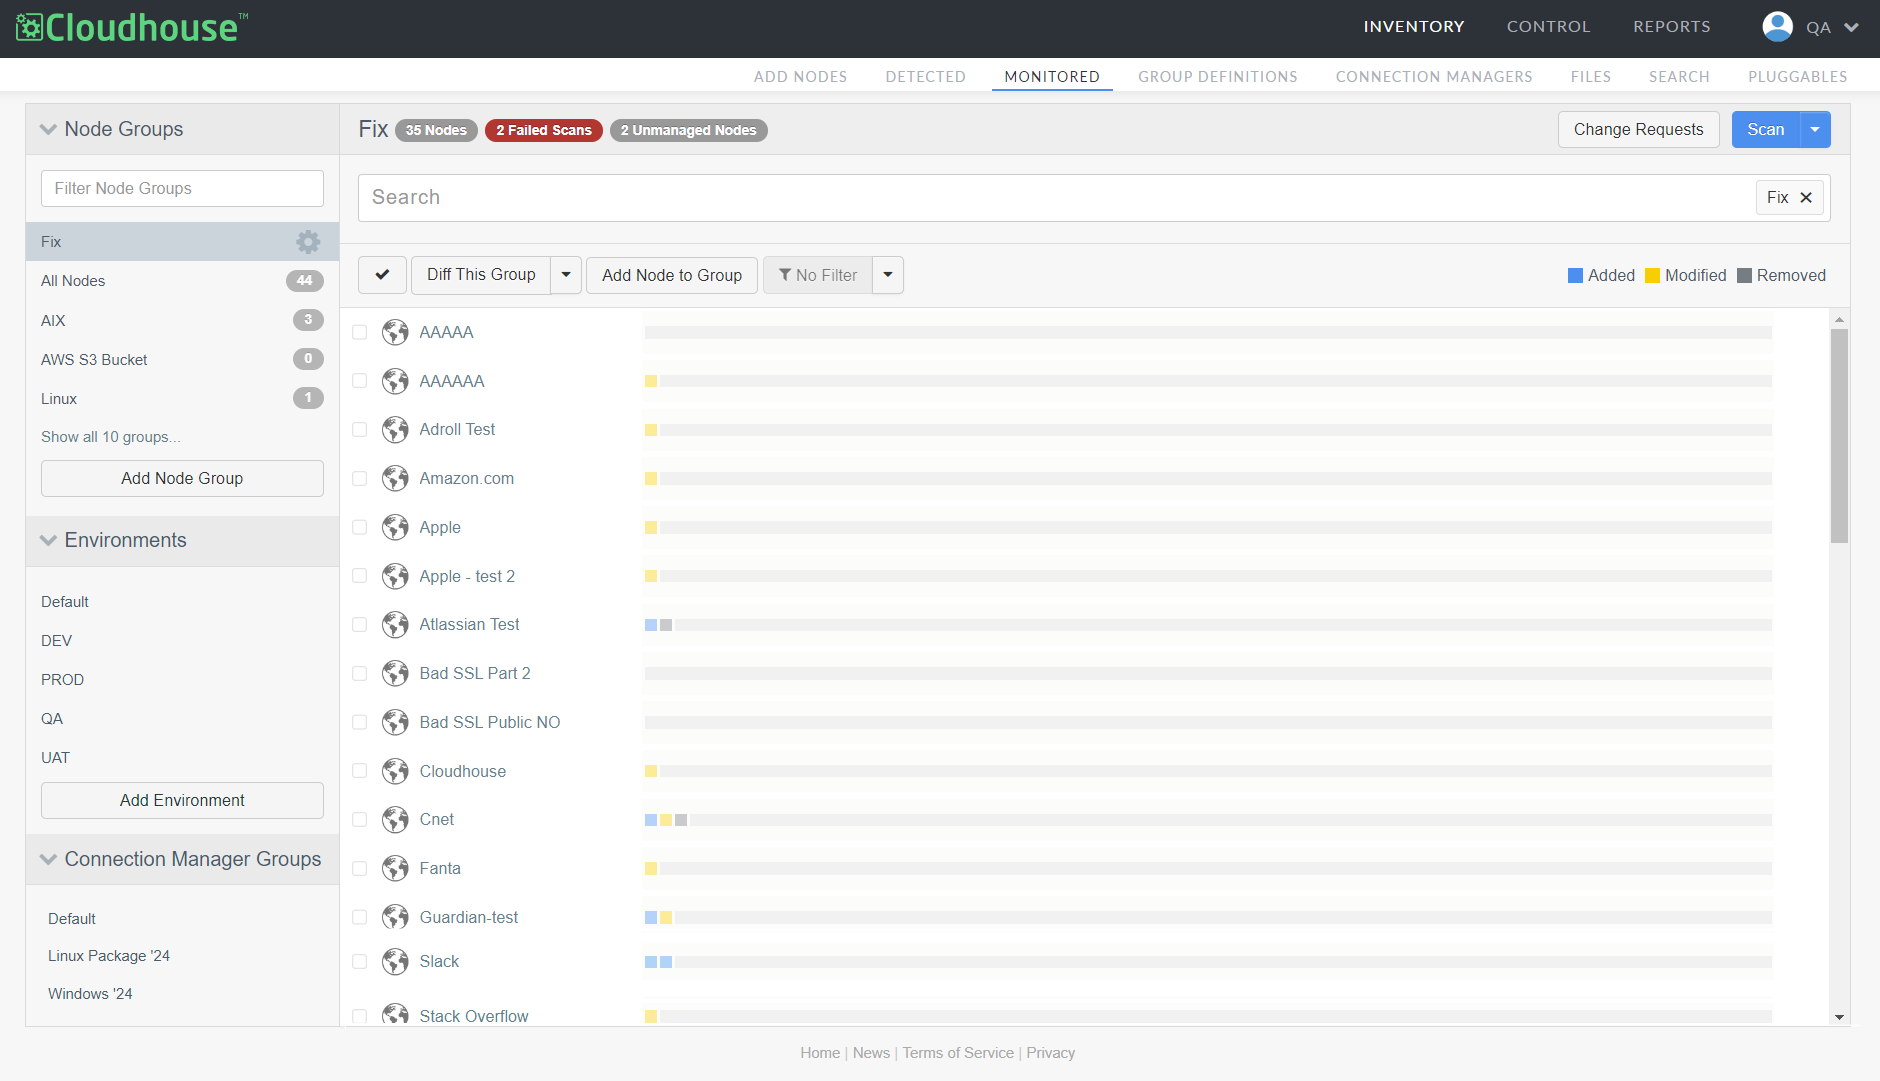
In the example above, the 'Fix' node group has been selected, displaying the complete set of nodes contained within that group. The Status Summary bar at the top of the page provides an overview of the nodes within that group, displaying the following:
-
How many nodes there are in total (35 Nodes).
-
How many nodes are failing to scan (2 Failed Scans).
-
How many nodes are unmanaged (2 Unmanaged Nodes).
Note: An unmanaged node, in this context, refers to a node that does not have any policies assigned. This status does not indicate whether the node has any benchmarks assigned. Nor whether the node has any event actions, alerts, or unauthorized change detection configured. To resolve an unmanaged node, assign a policy to the node group that applies to the unmanaged node(s).
Last Scan Status
When accessing a node group, environment, or Connection Manager group there is a lot of information you can uncover with minimal effort. For example, hovering your mouse over an individual node's name displays the Last Scan Status field. This field displays one of four values: Success, Exception, Error, or Offline.

Depending on the status, the node is assigned one of the following colored status bars:
|
Status |
Description |
|---|---|
| Success (White) |
The node was scanned successfully with no errors or exceptions. |
| Exception (Red) |
The node was unable to be scanned due to an exception occurring during the scan. |
| Error (Red) |
The node was unable to be scanned due to one or more errors occurring during the scan. |
| Offline (Black) |
The node is offline and unavailable for scanning due to the Guardian appliance being unable to connect to the Connection Manager responsible for scanning the node. |
Note: To access a list of all failing nodes, with the Exception / Error status, type =scan_failure in the Search bar at the top of the page and click Enter. Similarly, to access all Offline nodes, type =offline into the search bar and click Enter. For more information on how to use expression search queries to filter the results returned by the Search bar, see . However, the search bar is only displayed for node groups. For environments and connection manager groups, you can use the Filter ( ) options at the top of the page to similar effect.
Multi-Select Functionality
Alongside the Last Scan Status, each node has a checkbox that facilitates multi-select functionality. Here, you can select multiple nodes using the checkboxes in order to difference, edit, scan, delete, configure and/or add the selected nodes to a new or existing node group.
Note: If no nodes are selected, this functionality is applied to all nodes within the group or environment. Alternatively, you can select all nodes by clicking the Select All ( ) button.
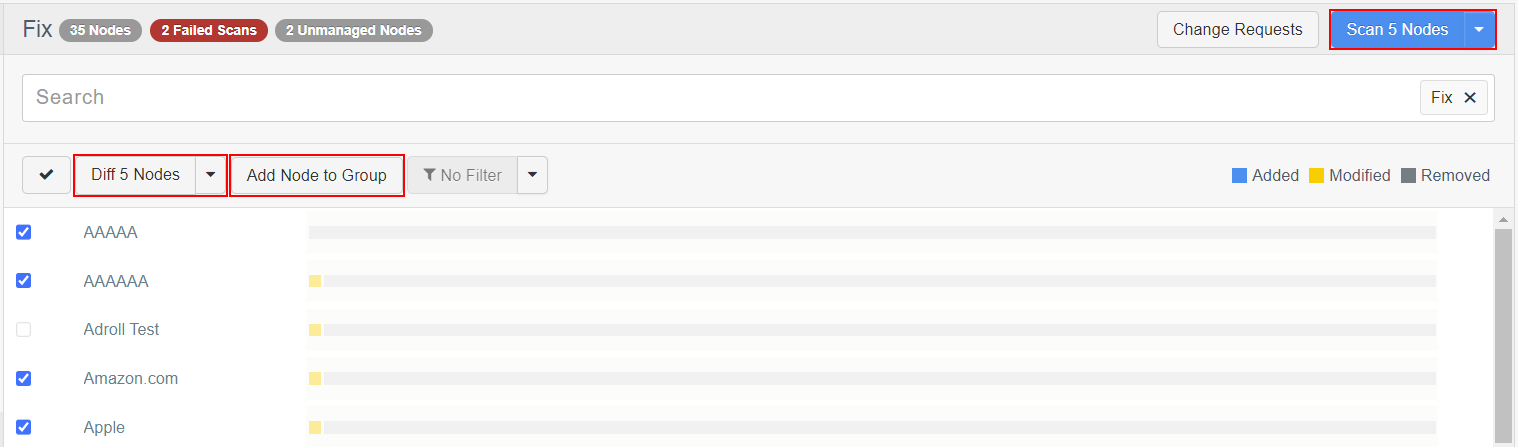
As described above, there are plenty of opportunities for customizing your node set. With multiple nodes selected, click the Diff X Nodes drop-down to display the following list of configurable options:
Note: Additionally, you can click the Scan button to trigger a manual scan of the selected nodes. For more information on the various options available for scanning nodes, see Scan Nodes. Additionally, for more information on the results of a manual scan, see Node Scan Results.
|
Option |
Description |
|---|---|
| Edit X Nodes |
Option to edit the selected nodes. If selected, the Edit X Nodes dialog is displayed. Click the Update Nodes button once you've applied the desired configuration settings. Tip: If the fields are blank, this indicates that the configuration is very different between the two selected nodes. Make sure to only apply settings to nodes that fit the stipulated criteria. For example, don't add Linux nodes to a Windows Connection Manager group, as they won't be eligible for scanning. |
| New Node Group From Nodes |
Option to create a new node group from the selected nodes. If selected, the Create a New Node Group dialog is displayed. Enter a Node Group Name in the field provided, then click to Create the group. For more information on how to create a node group, see Add Node Group. |
| Add X Nodes To A Group |
Option to add the selected nodes to an existing node group. If selected, the Add To Node Group dialog is displayed. Select a node group from the list of options by clicking the Add X Nodes button. Note: If no node groups are displayed, this indicates that there aren't any non-dynamic node groups to choose from. To resolve this issue, create a static node group. |
| Remove X Nodes From Group |
This option is not available to select for nodes within the Environments drop-down menu. Option to remove the selected nodes from the current node/connection manager group. If selected, the Remove X Nodes From Group dialog is displayed. Click OK to confirm the action. Note: This option is only available to select for nodes that have been manually added to a node group. Nodes that have been automatically added to a dynamic node group cannot be removed from their respective node group(s). |
| Delete X Nodes Permanently |
Option to delete the selected nodes from the Guardian instance permanently. If selected, a confirmation dialog is displayed. Click OK to confirm the action. |
| Install Real-Time Forwarder For X Nodes |
Option to install the Guardian Real-Time Forwarder on the selected nodes. If selected, the Enter Administration Credentials dialog is displayed. Enter the Username and Password of the administrator account associated with the selected nodes, then click Install. Note: The Real-Time Forwarder is an optional Guardian service that enables the tracking of changes that occur within file systems in real-time, as opposed to the default point-in-time snapshot functionality attributed to regular node scans. For more information, see Real-Time Forwarder. If the selected nodes already have the Real-Time Forwarder installed, this option is displayed as Uninstall Real-Time Forwarded for X Nodes instead. |
Alternatively, you can click Diff X Nodes to display a difference report for the selected nodes. For more information, see Configuration Differencing.